1 Architectural Foundations for High-Throughput Analytics
Modern production systems emit metrics continuously. CPU usage, request latency, cache efficiency, queue depth, and IoT sensor values are all produced as time-based signals, not occasional events. At scale, these signals arrive every few milliseconds and never really stop. In practice, senior developers and architects often assemble this using several loosely coupled parts: a metrics ingestion service, a time-series database, and a dashboard UI. What’s usually missing is a clear architectural model that explains how these parts should work together when the system must handle high write volume, fast queries, and real-time delivery to browsers.
This section establishes that model using SignalR and InfluxDB 3.0. The goal isn’t to describe every component in detail yet, but to give you a mental map of how data moves through the system—from the moment a metric is emitted to the moment it appears on a live dashboard.
1.1 The Shift from Pull-Based Polling to Push-Based Streams
Early monitoring systems were built around HTTP polling. A browser would periodically ask the server for new data, and the server would respond with the current state. This approach is easy to implement, but it breaks down quickly under real production load.
1.1.1 Inefficiency of Polling
Polling generates work even when nothing changes. If 1,000 users open a dashboard that polls once per second, the backend processes 1,000 requests per second regardless of whether there are new metrics to return. Each request still goes through authentication, routing, allocation, and serialization. As more dashboards open, the cost increases linearly. The system spends most of its time answering “nothing new” instead of doing useful work. This inefficiency becomes expensive once metrics volume or user count grows.
1.1.2 Increased Latency
Polling also introduces unavoidable delay. If clients poll every five seconds, the freshest data they can display is already up to five seconds old. When a metric spikes or a service degrades, the dashboard lags behind reality. Teams often describe these dashboards as “real-time,” but in practice they are sampling snapshots of the past. That delay matters when the dashboard is used for incident response or operational decision-making.
1.1.3 Push-Based Streams as the Default Model
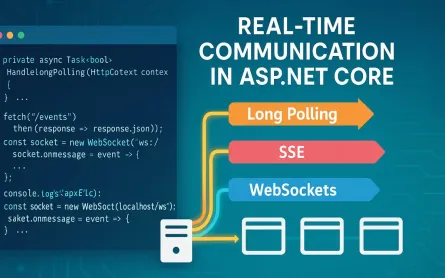
Persistent connections invert the model. Instead of clients repeatedly asking for updates, the server pushes updates the moment they are available. WebSockets, Server-Sent Events, and SignalR all enable this pattern.
Push-based streaming provides:
- Lower overall network traffic
- Lower end-to-end latency
- Predictable server load
- A true event-driven data flow
Metrics behave more like logs than records: they are append-only and time-ordered. Push-based delivery matches that reality and is better suited for high-frequency, high-volume monitoring systems.
1.2 Why SignalR + InfluxDB 3.0? Matching Time-Series Storage with Persistent Connections
SignalR and InfluxDB 3.0 address different parts of the problem, but they align well when used together.
1.2.1 Why InfluxDB 3.0?
InfluxDB 3.0 is designed specifically for time-series workloads at scale. Internally, it is built on:
- Apache Arrow for columnar, in-memory data representation
- Flight SQL for fast, streaming query execution
- A redesigned engine optimized for high write rates and high cardinality
Columnar storage is particularly important for metrics. Queries usually scan a single metric across a time window rather than entire rows. Arrow allows InfluxDB to process those values in tight, vectorized loops with minimal memory overhead. In practice, this means querying “the last 10 seconds of CPU usage” is fast enough to drive a live dashboard without caching or precomputing every result.
1.2.2 Why SignalR?
SignalR provides a reliable way to push data from the server to browsers over persistent connections. It handles:
- WebSocket connections with automatic fallbacks
- Connection lifetime management
- Group-based message routing
- Tight integration with the .NET hosting model
- Scale-out via backplanes
When a backend process computes a new metric value, SignalR can deliver it to connected clients almost immediately. Within a single node, delivery latency is typically sub-millisecond. With a backplane, that same model extends across multiple nodes.
1.2.3 Why They Work Well Together
InfluxDB and SignalR have clearly different responsibilities:
- InfluxDB stores and queries time-series data
- SignalR distributes the most recent updates
This separation matters. You avoid using the database as a message broker, and you avoid treating WebSocket connections as a storage system. InfluxDB handles durability, replay, and aggregation. SignalR handles immediacy. Together, they form a clean pipeline from metric ingestion to real-time visualization.
1.3 Logical Architecture: Ingestion Layer, Processing Layer, and Presentation Layer
A production-ready system benefits from explicit layering. For real-time analytics, three layers are enough to keep responsibilities clear and scalable.
1.3.1 Ingestion Layer
The ingestion layer receives metrics from producers and writes them to InfluxDB. Producers might include:
- Application services emitting internal metrics
- Background workers collecting system statistics
- IoT gateways aggregating device data
- Observability agents
This layer must be non-blocking and resilient. Writes should be batched and asynchronous to avoid slowing down producers. The ingestion layer does not care about dashboards or users—it only ensures metrics are recorded efficiently and reliably.
1.3.2 Processing Layer
The processing layer sits between storage and delivery. Its responsibilities include:
- Querying recent data from InfluxDB
- Aggregating or downsampling metrics
- Applying business rules or thresholds
- Publishing updates to SignalR hubs
This is where raw metrics become dashboard-friendly signals. For example, instead of sending every CPU sample, this layer may compute rolling averages or percentiles over short windows.
1.3.3 Presentation Layer
The presentation layer includes SignalR hubs and the frontend applications. Clients subscribe to streams based on their needs—for example:
- A tenant identifier
- A specific service or host
- A dashboard widget or metric type
Once subscribed, clients receive updates as they happen, without polling.
The end-to-end data flow looks like this:
- Metric emitted → ingestion layer
- Ingestion layer → InfluxDB
- Processing layer → queries and transforms
- SignalR → pushes updates to clients
1.3.4 Benefits of This Separation
This layering provides clear advantages:
- Scalability: ingestion, processing, and delivery scale independently
- Maintainability: each layer has a focused responsibility
- Fault isolation: a failure in one layer doesn’t collapse the others
- Latency control: each hop has a measurable and tunable budget
It also makes performance bottlenecks easier to identify and fix.
1.4 Evaluating Latency Budgets: From Hardware Sensors to Browser UI
Real-time dashboards only feel real-time if latency stays low and predictable. Achieving that requires understanding where time is spent.
1.4.1 Sensor → Ingestion Service
Latency here depends on the source. Local system metrics may arrive in under 5 ms, while industrial or remote IoT sensors may take 10–50 ms or more. Network jitter is often more important than average latency and must be accounted for.
1.4.2 Ingestion → InfluxDB Write Path
InfluxDB can ingest tens of thousands of points per second per node, but write strategy matters. Individual writes may take several milliseconds. Batched writes amortize that cost across many points, often reducing per-point overhead to well under 1 ms.
1.4.3 Query Latency
Query performance depends on schema design and query shape. Short time windows, reasonable tag cardinality, and pre-aggregated data typically result in query times between 5 and 25 ms for recent data. This is fast enough for sub-second update cycles.
1.4.4 SignalR Distribution
Within a single node, SignalR delivers messages to connected clients in roughly 1–2 ms. In a multi-node setup using a backplane, cross-node distribution typically adds 10–20 ms depending on network topology and load.
1.4.5 Browser Rendering
Even when data arrives instantly, the browser must still render it. Modern frameworks usually add around 10 ms per update. High-frequency updates often require throttling or smoothing to keep charts responsive.
1.4.6 Putting It Together
A realistic latency budget for a production dashboard might look like this:
- Sensor to ingestion: ~10 ms
- InfluxDB write: 2–5 ms
- Query and processing: 10–20 ms
- SignalR delivery: 2–10 ms
- Browser rendering: ~10 ms
Total end-to-end latency: 34–55 ms
That comfortably stays below the ~100 ms threshold where humans start to perceive delay, making the dashboard feel truly live.
2 High-Performance Data Ingestion with InfluxDB 3.0
Once metrics start flowing, the ingestion layer becomes the backbone of the entire system. It must absorb sudden spikes, preserve ordering within time windows, and write efficiently without becoming a bottleneck. If ingestion falls behind, everything downstream—queries, dashboards, and alerts—starts to drift out of sync with reality. InfluxDB 3.0 is designed for exactly this kind of workload, but getting the most out of it depends on how well you understand its internal model and how you structure writes. This section focuses on the practical decisions that make ingestion predictable and fast in a real-time dashboard architecture.
2.1 Understanding the Flight SQL and Apache Arrow Backbone in InfluxDB 3.0
InfluxDB 3.0 is built on Apache Arrow. That choice shapes how data is written, stored, and queried. Arrow is a columnar memory format, meaning values are stored column-by-column instead of row-by-row. For metrics, this is a natural fit.
2.1.1 Benefits of Columnar Storage
Columnar storage aligns well with how metrics are queried. Dashboards usually ask questions like “what was CPU usage over the last 10 seconds?” rather than “show me all fields for this row.” Arrow enables:
- Vectorized CPU execution over contiguous memory
- SIMD-friendly operations on numeric values
- Zero-copy transfers between components
- High compression for repeated numeric patterns
Instead of scanning full rows, InfluxDB reads just the usage column for cpu_metrics. This keeps cache usage tight and query latency low, even when datasets grow large.
2.1.2 Why Flight SQL Matters
Flight SQL is a gRPC-based protocol layered on top of Arrow Flight. It allows InfluxDB to stream query results efficiently in columnar batches rather than materializing everything upfront.
Practically, this means:
- Queries start returning data almost immediately
- Large result sets don’t block memory
- Network overhead is reduced due to compact binary encoding
The InfluxDB 3.0 .NET client uses Flight SQL internally for queries. That’s why even short rolling-window queries—like “last 5 seconds of metrics”—can run frequently without overwhelming the database.
2.2 Schema Design for Metrics: Tags vs. Fields for Optimized Cardinality
Schema design is one of the most important decisions you’ll make with InfluxDB. It directly affects write speed, query latency, and memory usage. The key distinction is between tags and fields.
2.2.1 What Tags Do
Tags are indexed and used for filtering and grouping. They should describe where or from whom a metric originates. Common examples in a production dashboard include:
hostregiontenantIdserviceName
Tags are powerful, but dangerous when misused. Putting highly variable values—like request IDs or GUIDs—into tags causes cardinality explosions. Once cardinality grows uncontrollably, query planning slows down and memory usage spikes.
2.2.2 What Fields Do
Fields store the actual metric values. They are not indexed and are optimized for high-volume writes. Fields are ideal for:
- Gauges like CPU or memory usage
- Counters such as request totals
- Sensor readings that change frequently
Because fields aren’t indexed, you can safely write millions of distinct values without impacting query planning.
2.2.3 Example Schema
A typical metric written by the ingestion layer might look like this:
measurement: cpu_metrics
tags:
  host: server-42
  region: us-east
  tenantId: 9912
fields:
  usage: 73.2
  temperature: 41.5
timestamp: 2024-05-12T10:15:30Z
Here, tags identify where the metric came from, while fields capture what was measured.
2.2.4 Choosing Correct Tag Cardinality
A simple rule of thumb:
- Tag cardinality should be bounded and predictable
- Field cardinality can grow freely
If you wouldn’t comfortably list all possible values for a tag on a whiteboard, it probably doesn’t belong in a tag. Keeping this discipline is one of the biggest contributors to long-term InfluxDB performance.
2.3 Implementing the InfluxDB.Client and InfluxDB.Client.Linq for .NET
From a .NET perspective, ingestion typically uses two libraries:
InfluxDB.Clientfor writing dataInfluxDB.Client.Linqfor strongly typed queries
Using them together keeps ingestion and processing code consistent and readable.
2.3.1 Writing Data from an Ingestion Service
A background worker or ingestion endpoint usually writes metrics like this:
var influx = InfluxDBClientFactory.Create(
    "http://localhost:8086",
    "my-token");

var point = PointData
    .Measurement("cpu_metrics")
    .Tag("host", "server-42")
    .Tag("region", "us-east")
    .Field("usage", cpuUsage)
    .Timestamp(DateTime.UtcNow, WritePrecision.Ns);

await influx
    .GetWriteApiAsync()
    .WritePointAsync(point, "prod_bucket", "prod_org");
This example mirrors the schema discussed earlier and keeps write operations explicit and predictable.
2.3.2 Querying with LINQ for Recent Windows
LINQ-based queries translate into Flight SQL queries under the hood. For example, querying the last minute of CPU usage for a specific host:
var query = influx
    .GetQueryApiSync()
    .Queryable<CpuMetric>("prod_bucket")
    .Where(p => p.Host == "server-42")
    .Where(p => p.Time > DateTime.UtcNow.AddMinutes(-1))
    .Select(p => new { p.Time, p.Usage });

foreach (var row in query)
{
    Console.WriteLine($"{row.Time:o} → {row.Usage}");
}
This style works well in processing layers where readability matters and queries are relatively simple.
2.3.3 Client Lifecycle and Connection Management
The InfluxDB client is thread-safe. Create it once and reuse it across the application. Creating a new client per request leads to unnecessary TCP connections and authentication overhead, which quickly becomes visible under load.
2.4 Batching Strategies: Balancing Real-Time Updates with Write Efficiency
Writing each metric individually is expensive. Batching amortizes network and serialization costs while still supporting near-real-time behavior.
2.4.1 Choosing Batch Sizes
Batch size is a trade-off between latency and throughput:
- Small batches (10–20 points): lowest latency, higher overhead
- Medium batches (50–200 points): best balance for dashboards
- Large batches (>500 points): maximum throughput, higher latency risk
Most real-time dashboards benefit from medium-sized batches flushed frequently.
2.4.2 Asynchronous Batch Writes
Using the async write API keeps ingestion non-blocking:
var writeApi = influx.GetWriteApiAsync();

await writeApi.WritePointsAsync(
    pointsBatch,
    "prod_bucket",
    "prod_org");
This approach allows ingestion services to continue collecting metrics while writes complete in the background.
2.4.3 Flush Triggers
Two common flush strategies work well together:
- Time-based flushing for irregular or low-frequency metrics
- Size-based flushing for continuous, high-volume streams
Combining both ensures that metrics don’t sit in memory too long while still keeping write efficiency high.
2.5 Data Retention Policies and Downsampling for Long-Term Storage
Not all metrics need to be kept forever at full resolution. Retention and downsampling help control storage cost and query performance.
2.5.1 Retention Policies
A common retention strategy for dashboards looks like this:
- Raw metrics: 12–48 hours
- 1-minute aggregates: 30 days
- 5-minute aggregates: 6 months
- 1-hour aggregates: 2 years
Recent data remains detailed for live dashboards, while older data is summarized.
2.5.2 Downsampling Strategies
Downsampling reduces data volume while preserving trends:
SELECT mean(usage)
INTO cpu_usage_1m
FROM cpu_usage
GROUP BY time(1m), host, region;
Dashboards querying longer time ranges can use these aggregates instead of scanning raw points.
2.5.3 Tiered Storage
InfluxDB supports tiered storage, keeping hot, recent data on fast local storage and moving cold data to object storage. This allows the system to scale to large datasets without a linear increase in cost.
3 Designing a Resilient SignalR Hub Infrastructure
Once metrics are ingested and processed, SignalR becomes the delivery engine. This layer is responsible for pushing updates to browsers with minimal delay while handling thousands of long-lived connections. Small design decisions here have an outsized impact on latency, memory usage, and operational stability. A resilient SignalR hub infrastructure favors predictable behavior over flexibility, minimizes per-connection overhead, and treats every connected client as a long-running resource rather than a short-lived request.
3.1 Hub Design Patterns: Typed Hubs vs. Dynamic Hubs for Performance
SignalR supports two hub styles. Both work, but they behave very differently under load.
3.1.1 Dynamic Hubs
Dynamic hubs rely on string-based method names:
await Clients.All.SendAsync("ReceiveMetricUpdate", dto);This approach is flexible and quick to prototype, but it has drawbacks in production:
- No compile-time validation of method names
- Runtime errors if client and server drift
- Extra overhead from method name lookup
- Harder to refactor safely
For dashboards that evolve over time, these issues surface quickly.
3.1.2 Typed Hubs
Typed hubs define a shared contract between the server and the client:
public interface IMetricsClient
{
    Task ReceiveMetricUpdate(MetricDto metric);
    Task ReceiveAlert(AlertDto alert);
}

public class MetricsHub : Hub<IMetricsClient>
{
}
This pattern provides:
- Compile-time safety for hub methods
- Faster dispatch with less runtime indirection
- Clear, self-documenting contracts
- Easier unit and integration testing
In a production metrics dashboard, typed hubs are the default choice. They reduce accidental breaking changes and make it clear which messages the hub is responsible for delivering.
3.2 Connection Management: Handling Thousands of Concurrent WebSockets
Unlike HTTP requests, SignalR connections stay open for minutes or hours. Each connection consumes memory, holds state, and participates in broadcasts. Designing for thousands of concurrent connections requires a different mindset.
3.2.1 What Actually Limits Connection Scale
In practice, the limits are not WebSockets themselves but:
- CPU time spent serializing and broadcasting messages
- Memory used per connection
- Backplane overhead when scaling across nodes
A well-configured SignalR node can handle thousands of idle connections easily. Problems appear when every connection receives frequent updates.
3.2.2 Minimizing Per-Connection Cost
Keep connection state small and avoid storing per-connection objects that grow over time. Avoid attaching large data structures or caches to Context.Items.
SignalR already manages keep-alives internally. Adding custom heartbeat or ping messages usually increases traffic without improving reliability.
3.2.3 Scaling Out Predictably
Once a single node approaches CPU or memory limits, scale horizontally. Multiple SignalR nodes behind a load balancer provide:
- Higher connection capacity
- Fault tolerance
- Rolling deployment support
A backplane (discussed later) ensures messages reach clients regardless of which node they’re connected to.
3.3 Advanced Grouping Strategies: Segmenting Users by Tenant or Metric ID
Broadcasting every metric update to every connected client does not scale. Groups are the primary mechanism for controlling fan-out.
3.3.1 Grouping by Tenant
In a multi-tenant metrics dashboard, tenant-based grouping is the first layer of isolation.
var tenantId = Context.User.FindFirst("tenant")?.Value;
await Groups.AddToGroupAsync(Context.ConnectionId, tenantId);
Publishing updates becomes straightforward:
await Clients
    .Group(tenantId)
    .ReceiveMetricUpdate(dto);
This ensures that tenants only receive their own data and avoids unnecessary serialization work.
3.3.2 Grouping by Metric or Dashboard Context
For dashboards that allow users to subscribe to specific metrics:
await Groups.AddToGroupAsync(
    Context.ConnectionId,
    $"metric-{metricId}");
This pattern allows fine-grained control. A CPU usage chart doesn’t need memory or disk metrics pushed to it.
3.3.3 Combining Grouping Strategies
In practice, systems often combine strategies:
- Tenant group → coarse isolation
- Metric group → fine-grained targeting
For example, a client might belong to both tenant-9912 and metric-cpu. Updates can then be scoped precisely, keeping broadcast volume low.
3.4 Lifecycle Hooks: Managing OnConnectedAsync and OnDisconnectedAsync at Scale
SignalR exposes lifecycle hooks that run when clients connect or disconnect. These hooks are powerful but easy to misuse.
3.4.1 OnConnectedAsync
This method runs when a connection is established. Typical responsibilities include:
- Validating identity and claims
- Assigning groups
- Sending initial state or metadata
Example:
public override async Task OnConnectedAsync()
{
    var tenantId = Context.User.FindFirst("tenant")?.Value;
    if (!string.IsNullOrEmpty(tenantId))
    {
        await Groups.AddToGroupAsync(Context.ConnectionId, tenantId);
    }

    await base.OnConnectedAsync();
}
Keep this method fast. Avoid database calls or long-running IO. Any delay here slows connection establishment and increases resource usage under load.
3.4.2 OnDisconnectedAsync
This method is called when SignalR detects a disconnect:
public override async Task OnDisconnectedAsync(Exception? exception)
{
    // cleanup logic
    await base.OnDisconnectedAsync(exception);
}
Disconnects are not always graceful. Network failures, browser crashes, and mobile transitions may prevent this method from running immediately—or at all. Treat it as a best-effort cleanup hook, not a guaranteed signal.
3.4.3 Where to Store Connection State
If you need to track subscriptions or connection metadata:
- Use in-memory structures for fast access
- Use Redis or another cache for cross-node visibility
- Avoid relational databases for per-connection state
Writing to a database on every connect or disconnect becomes a bottleneck long before WebSocket limits are reached.
3.5 Security: Implementing JWT Authentication and Claims-Based Authorization in SignalR
SignalR inherits ASP.NET Core’s authentication model, but WebSockets introduce a few practical differences.
3.5.1 JWT Authentication for WebSockets
Because browsers cannot send headers during the WebSocket upgrade in all scenarios, tokens are often passed via query string:
builder.Services
    .AddAuthentication("Bearer")
    .AddJwtBearer("Bearer", options =>
    {
        options.Authority = "https://auth.example.com";
        options.TokenValidationParameters = new TokenValidationParameters
        {
            ValidateAudience = false
        };

        options.Events = new JwtBearerEvents
        {
            OnMessageReceived = context =>
            {
                var token = context.Request.Query["access_token"];
                if (!string.IsNullOrEmpty(token) &&
                    context.HttpContext.WebSockets.IsWebSocketRequest)
                {
                    context.Token = token;
                }
                return Task.CompletedTask;
            };
        };
    });
This pattern allows the same JWT used for REST APIs to secure SignalR connections.
3.5.2 Authorizing Hub Access
Hubs can be protected just like controllers:
[Authorize(Roles = "MetricsReader")]
public class MetricsHub : Hub<IMetricsClient>
{
}
This ensures only authorized users can subscribe to real-time updates.
3.5.3 Claims-Based Routing and Isolation
Claims are also useful for routing:
var tenantId = Context.User.FindFirst("tenant")?.Value;
await Groups.AddToGroupAsync(Context.ConnectionId, tenantId);
This keeps authorization and routing aligned and avoids hardcoding tenant logic into the hub.
3.5.4 Handling Token Expiration
SignalR does not revalidate tokens during an active connection. When a token expires, the client must reconnect with a refreshed token. Client libraries typically handle this by listening for disconnect events, refreshing the token, and re-establishing the connection automatically.
4 Scaling the SignalR Tier with Redis and Beyond
As traffic grows, a single SignalR node eventually becomes a constraint. While one instance can handle several thousand concurrent connections, production systems rarely stay that simple for long. You need redundancy for failures, headroom for traffic spikes, and the ability to deploy without disconnecting users. Horizontal scaling solves those problems, but it introduces a new one: keeping message delivery consistent across nodes. This section explains how the Redis backplane fits into that picture, how to configure it correctly, and when it makes sense to move beyond Redis entirely.
4.1 The Role of the Redis Backplane in a Distributed SignalR Cluster
Inside a single SignalR node, broadcasts are cheap because everything lives in memory. Once you introduce multiple nodes behind a load balancer, each node has its own isolated set of connections. Without coordination, a message sent on one node never reaches clients connected to another.
A backplane bridges that gap by synchronizing messages across all SignalR instances.
4.1.1 How Redis Functions as a Backplane
Redis uses a simple Pub/Sub model that maps well to SignalR’s needs. When a hub broadcasts an update:
- The local node publishes the message to a Redis channel
- Redis immediately fans the message out to all subscribers
- Each SignalR node receives the message and delivers it to its local clients
Redis does not persist these messages. That’s intentional. For a real-time dashboard, the most recent value matters far more than replaying old updates. Redis prioritizes throughput and low latency, which keeps the delivery path fast.
4.1.2 When a Redis Backplane Becomes Necessary
A Redis backplane is required as soon as:
- SignalR runs on more than one node
- High availability is a requirement
- Clients must receive the same updates regardless of which node they connect to
A common warning sign is inconsistent dashboards—two browser tabs showing different values at the same time. In most cases, that’s caused by missing or misconfigured backplane synchronization.
4.2 Implementing StackExchange.Redis for Reliable Message Distribution
SignalR integrates with Redis through the Microsoft.AspNetCore.SignalR.StackExchangeRedis package. The basic setup is straightforward, but production systems benefit from a more deliberate configuration.
4.2.1 Basic Integration
A minimal configuration looks like this:
builder.Services
    .AddSignalR()
    .AddStackExchangeRedis("redis:6379", options =>
    {
        options.Configuration.ChannelPrefix = "metrics";
    });
The channel prefix ensures that only SignalR traffic for this application flows through these Redis channels. In environments with multiple clusters or stages, this prevents accidental cross-talk.
4.2.2 Hardening Redis Connections for Production
Under load, Redis connections must survive transient failures, restarts, and network jitter. The default configuration works for development but is often too optimistic for production.
A more resilient setup:
var redisConfig = new ConfigurationOptions
{
    EndPoints = { "redis-cluster:6379" },
    AbortOnConnectFail = false,
    ConnectRetry = 5,
    ConnectTimeout = 5000,
    SyncTimeout = 5000,
    KeepAlive = 30
};

builder.Services
    .AddSignalR()
    .AddStackExchangeRedis(redisConfig);
This configuration favors recovery over fast failure. Small latency spikes are normal during high fan-out broadcasts, and aggressive timeouts often make things worse rather than better.
4.2.3 Reducing Payload Cost Across the Backplane
Redis transports raw byte arrays. When metric updates are frequent, reducing payload size has a direct impact on CPU usage and network bandwidth.
Enabling binary payloads and setting sane message limits:
builder.Services
    .AddSignalR()
    .AddHubOptions<MetricsHub>(options =>
    {
        options.MaximumReceiveMessageSize = 64 * 1024;
    })
    .AddStackExchangeRedis(redisConfig, options =>
    {
        options.UseBinary = true;
    });
Combined with binary serialization (MessagePack or Protobuf), this significantly improves fan-out performance under load.
4.3 Alternatives to Redis: NATS and Azure SignalR Service
Redis works well for most deployments, but it has limits. Pub/Sub messages are ephemeral, and Redis does not automatically solve multi-region distribution. When dashboards need to serve users across continents, other options become more attractive.
4.3.1 NATS for High-Throughput, Global Messaging
NATS is a high-performance messaging system designed for low latency and massive fan-out. It supports:
- Automatic clustering and mesh formation
- Multi-region routing
- Extremely high throughput
With JetStream, NATS can also persist messages when needed. SignalR doesn’t provide native NATS support, but advanced teams often implement custom hub lifetime managers.
A simplified example:
public class NatsHubLifetimeManager<THub> : HubLifetimeManager<THub>
    where THub : Hub
{
    private readonly IConnection _nats;

    public NatsHubLifetimeManager(IConnection nats)
    {
        _nats = nats;
    }

    public override Task SendAllAsync(
        string methodName,
        object?[] args,
        CancellationToken cancellationToken = default)
    {
        var payload = Serialize(methodName, args);
        _nats.Publish("metrics.broadcast", payload);
        return Task.CompletedTask;
    }
}
This approach requires more engineering effort but enables real-time delivery at a global scale.
4.3.2 Azure SignalR Service
Azure SignalR Service moves connection management out of your application entirely. It provides:
- Automatic global routing
- Managed WebSocket infrastructure
- Built-in scale-out
- Reduced operational complexity
The trade-off is cost and reduced control. For globally distributed dashboards with unpredictable traffic, the operational simplicity can outweigh the expense.
4.3.3 When Redis Stops Being Enough
Redis is usually sufficient until:
- Backplane latency regularly exceeds 30–50 ms
- Pub/Sub throughput limits are reached
- The cluster spans multiple geographic regions
- Operational overhead outweighs its simplicity
Most systems will reach user-interface limits before Redis becomes the bottleneck.
4.4 Sticky Sessions and Load Balancer Configuration
WebSocket connections behave very differently from stateless HTTP traffic. Once a connection is established, it must remain bound to the same backend instance. Load balancers need to respect that.
4.4.1 NGINX Configuration
A typical NGINX configuration for SignalR looks like this:
location /hub/metrics {
    proxy_pass         http://signalr_cluster;
    proxy_http_version 1.1;
    proxy_set_header   Upgrade $http_upgrade;
    proxy_set_header   Connection "Upgrade";
    proxy_read_timeout 600s;
    proxy_set_header   Host $host;

    sticky cookie srv_id expires=1h path=/hub/metrics;
}
Sticky sessions ensure that reconnects land on the same node whenever possible, reducing backplane churn and improving stability.
4.4.2 HAProxy Configuration
With HAProxy, session affinity is usually cookie-based:
backend signalr_nodes
    balance roundrobin
    cookie SESSID prefix
    server node1 10.0.0.1:5000 cookie n1 check
    server node2 10.0.0.2:5000 cookie n2 check
The objective is the same: keep each WebSocket connection pinned to one backend for its lifetime.
4.4.3 Managing Idle Timeouts
Many load balancers default to closing idle connections after 60 seconds. SignalR’s built-in keep-alive messages usually prevent this, but custom timeouts should be reviewed carefully. Unexpected disconnects often trace back to aggressive idle timeout settings.
4.5 Monitoring Backplane Latency and Preventing the “Death Spiral”
One of the most dangerous failure modes in real-time systems is the message death spiral. As delivery slows, queues grow. As queues grow, CPU usage spikes. As CPU spikes, delivery slows further.
4.5.1 Metrics That Matter
To catch problems early, monitor:
- Redis round-trip latency
- Message fan-out duration per node
- Pending broadcast counts
- CPU and GC pressure on SignalR nodes
These metrics tell you whether the system is keeping up or falling behind.
4.5.2 Recognizing Early Warning Signs
In a healthy system, backplane fan-out stays under 5–10 ms. Sustained latencies above 40 ms indicate trouble. Common warning signals include:
- Clients falling behind real-time values
- Sudden drops in active subscriptions
- Redis Pub/Sub slow consumer warnings
4.5.3 Mitigation Strategies
When pressure builds, mitigation options include:
- Dropping stale updates in favor of the latest value
- Switching to message conflation
- Reducing payload size or update frequency
- Scaling Redis or adding SignalR nodes
Well-designed systems degrade gracefully instead of collapsing under load.
5 Managing Backpressure and Message Throughput
Once a system can ingest, process, and distribute metrics at scale, the next challenge is restraint. A real-time dashboard is only useful if it stays responsive. Without backpressure controls, even a well-architected pipeline can overwhelm clients with more data than they can reasonably consume. This section focuses on keeping the data stream smooth and predictable—protecting browsers from overload while still delivering fresh, meaningful updates.
5.1 The “Firehose” Problem: Protecting the Client from Data Overload
Real-time metrics naturally tempt teams to push every update as soon as it arrives. At scale, that approach quickly turns into a firehose. Browsers are not designed to process hundreds of updates per second across multiple charts.
When clients are flooded, the user experience degrades in very visible ways.
5.1.1 What Overload Looks Like in Practice
Common symptoms include:
- Charts flickering or skipping frames
- UI interactions becoming sluggish
- Increased memory usage in the browser
- Rendering falling behind incoming messages
The key issue is that rendering is single-threaded. If updates arrive faster than the browser can draw, work piles up and the UI stalls.
5.1.2 Where Firehose Conditions Come From
Firehose scenarios usually appear when:
- Sensors emit many samples per second
- Multiple dashboard widgets subscribe to the same raw stream
- Raw metrics are streamed instead of short-window aggregates
At this point, “real-time” stops being helpful. The system needs to decide which updates matter and which can be safely skipped.
5.2 Server-Side Throttling and Message Conflation
The most effective place to control throughput is the server. By the time data reaches the browser, it’s often too late to fix overload cleanly.
5.2.1 Throttling Update Frequency
Throttling limits how often a client receives updates, regardless of how frequently the backend produces them.
A simple per-stream throttler:
private readonly Throttle _throttle =
    new(TimeSpan.FromMilliseconds(200));

public async Task BroadcastMetricAsync(MetricDto dto)
{
    if (_throttle.Allow())
    {
        await Clients
            .Group(dto.TenantId)
            .ReceiveMetricUpdate(dto);
    }
}
In this example, even if metrics arrive every 20 ms, clients see at most five updates per second. That rate is usually more than enough for smooth charts.
5.2.2 Message Conflation: Sending Only What Matters
Conflation takes a different approach. Instead of limiting frequency, it collapses multiple updates into a single “latest value.”
private MetricDto? _latest;
private readonly object _sync = new();

public void EnqueueMetric(MetricDto dto)
{
    lock (_sync)
    {
        _latest = dto;
    }
}

public async Task FlushAsync()
{
    MetricDto? snapshot;
    lock (_sync)
    {
        snapshot = _latest;
        _latest = null;
    }

    if (snapshot != null)
    {
        await Clients
            .Group(snapshot.TenantId)
            .ReceiveMetricUpdate(snapshot);
    }
}
A timer triggers FlushAsync() at a fixed interval. Clients always receive the most recent value, without being overwhelmed by intermediate updates that they would never render anyway.
5.3 Using System.Threading.Channels for High-Speed Buffering
As systems scale, ad-hoc queues and locks become fragile. System.Threading.Channels provides a structured way to buffer and process metric updates under pressure.
5.3.1 Why Channels Fit This Problem Well
Channels provide:
- Bounded buffers that naturally enforce backpressure
- Asynchronous readers and writers
- Clear behavior when buffers fill up
- Minimal locking overhead
They’re well suited to real-time pipelines where producers and consumers operate at different speeds.
5.3.2 Creating a Bounded Channel
A bounded channel ensures the system never accumulates unbounded backlog:
var channel = Channel.CreateBounded<MetricDto>(
    new BoundedChannelOptions(100)
    {
        FullMode = BoundedChannelFullMode.DropOldest
    });
When the buffer fills, older updates are discarded automatically. For dashboards, this is usually the correct behavior—the latest value is what matters.
5.3.3 Processing Loop
A background task reads from the channel and publishes updates:
_ = Task.Run(async () =>
{
    await foreach (var metric in channel.Reader.ReadAllAsync())
    {
        await hubContext
            .Clients
            .Group(metric.TenantId)
            .ReceiveMetricUpdate(metric);
    }
});
This pattern keeps ingestion and delivery decoupled. If delivery slows temporarily, the channel absorbs the pressure without blocking producers.
5.4 Client-Side Backpressure and Flow Control
Even with server-side protections, clients still need to manage how they apply updates. Browsers vary widely in performance, especially on lower-end devices.
5.4.1 Smoothing Updates with a Render Queue
A simple render queue limits how often the UI updates:
const queue = [];
let rendering = false;

connection.on("ReceiveMetricUpdate", metric => {
  queue.push(metric);
  if (!rendering) renderLoop();
});

async function renderLoop() {
  rendering = true;
  while (queue.length > 0) {
    const latest = queue.shift();
    updateChart(latest);
    await new Promise(r => setTimeout(r, 16));
  }
  rendering = false;
}
This caps rendering at roughly 60 frames per second and prevents the UI thread from being overwhelmed.
5.4.2 Dropping Excess Client-Side Work
If updates arrive faster than they can be rendered:
if (queue.length > 100) {
  queue.splice(0, queue.length - 10);
}
This keeps memory usage stable and ensures the dashboard stays responsive.
5.4.3 Scheduling Work During Idle Time
For non-critical visual updates, APIs like requestIdleCallback() allow the browser to update charts when it’s less busy. This reduces contention with user interactions.
5.5 Network Jitter, Reconnection, and Data Recovery
Real-world networks are imperfect. Mobile clients roam between networks, Wi-Fi drops packets, and transient outages happen. A real-time dashboard must handle these gracefully.
5.5.1 Configuring Automatic Reconnection
SignalR’s reconnection logic provides controlled retries:
const connection = new signalR.HubConnectionBuilder()
  .withUrl("/hub/metrics")
  .withAutomaticReconnect([0, 2000, 5000, 10000])
  .build();
This staggered backoff avoids reconnection storms when many clients disconnect simultaneously.
5.5.2 Detecting Stale Streams
Clients can detect when updates stop arriving:
let lastUpdate = Date.now();

setInterval(() => {
  if (Date.now() - lastUpdate > 5000) {
    connection.stop().then(() => connection.start());
  }
}, 2000);

connection.on("ReceiveMetricUpdate", () => {
  lastUpdate = Date.now();
});
This ensures dashboards don’t silently freeze.
5.5.3 Server-Side Heartbeats
Servers can optionally emit lightweight heartbeat messages:
await Clients
    .Group(tenantId)
    .SendAsync("Heartbeat", DateTime.UtcNow);
Clients use these to verify liveness when metric traffic is sparse.
5.5.4 Recovering After Reconnects
After reconnecting, clients should:
- Query recent metrics from InfluxDB
- Fill gaps in charts
- Resume live streaming
This hybrid pull-then-push approach keeps dashboards accurate without forcing a full page reload.
6 Performance Engineering: Native AOT and Serialization
By the time metrics reach the SignalR layer, most architectural decisions are already locked in. InfluxDB handles storage and aggregation, SignalR handles fan-out, and clients are connected over long-lived WebSockets. At this stage, performance problems usually don’t come from “slow code” in one place. They come from small inefficiencies repeated thousands of times per second. This section focuses on tightening the runtime behavior of the system: reducing allocations, keeping latency predictable, and making sure throughput stays flat under peak load. These optimizations matter most when the dashboard is actively streaming updates to many connected clients.
6.1 Optimizing for Native AOT (Ahead-of-Time) Compilation in .NET 10
Native AOT changes how your SignalR service behaves in production. Instead of compiling code on demand at runtime, the application is fully compiled to a native binary ahead of time. For long-running, high-throughput services, this removes an entire class of performance variability.
6.1.1 Why Native AOT Helps Real-Time Systems
In a real-time metrics dashboard, you want predictable behavior:
- Fast startup when pods are rescheduled
- No JIT pauses when new code paths execute
- Lower memory usage per instance
Native AOT delivers exactly that. Once the process starts, execution characteristics remain stable, even under sustained load.
6.1.2 Preparing the Project for AOT
Native AOT requires aggressive trimming. Anything accessed via reflection must be declared explicitly.
A minimal project configuration:
<PropertyGroup>
  <PublishAot>true</PublishAot>
  <TrimMode>full</TrimMode>
  <InvariantGlobalization>true</InvariantGlobalization>
</PropertyGroup>
This setup produces a small, self-contained binary that starts quickly and consumes less memory per SignalR node.
6.1.3 Handling Reflection and Serialization
SignalR hubs, DTOs, and serializers often rely on reflection. These types must be preserved during trimming.
Example reflection configuration:
{
  "assembly": "MetricsApp",
  "type": "MetricsApp.Contracts.MetricDto",
  "dynamic": false,
  "serialization": {
    "ignoreDataMember": false
  }
}
Without this, the application may work in development and fail in production after trimming removes required metadata.
6.1.4 Operational Benefits
In practice, Native AOT provides:
- Sub-100 ms cold starts
- Smaller container images
- Fewer GC pauses
- More predictable scaling behavior
These advantages become noticeable once you run multiple SignalR replicas behind a load balancer.
6.2 High-Efficiency Serialization: Moving Beyond JSON
JSON is convenient, but it is not designed for high-frequency streaming. It is verbose, allocation-heavy, and expensive to parse. When metrics update several times per second across thousands of clients, JSON quickly becomes a bottleneck.
6.2.1 Why Binary Serialization Matters
Switching to a binary format typically results in:
- 60–80% smaller payloads
- Faster serialization and deserialization
- Lower CPU usage on both server and client
For real-time dashboards, these savings translate directly into smoother charts and higher connection limits per node.
6.2.2 MessagePack for SignalR
MessagePack integrates cleanly with SignalR and works well for DTO-based messages.
Example metric DTO:
[MessagePackObject]
public sealed class MetricDto
{
    [Key(0)] public string MetricId { get; init; }
    [Key(1)] public double Value { get; init; }
    [Key(2)] public long Timestamp { get; init; }
}
SignalR configuration:
builder.Services
    .AddSignalR()
    .AddMessagePackProtocol();
This change alone often cuts CPU usage on SignalR nodes by a noticeable margin.
6.2.3 Protocol Buffers for Cross-Language Systems
Protobuf is a better fit when metrics are consumed by services written in multiple languages.
Example schema:
syntax = "proto3";

message MetricUpdate {
  string metricId = 1;
  double value = 2;
  int64 timestamp = 3;
}
Protobuf enforces a stable schema, which is useful when dashboards evolve independently of backend services.
6.2.4 Choosing Between MessagePack and Protobuf
A practical guideline:
- MessagePack: fastest iteration, best for .NET-heavy stacks
- Protobuf: stronger versioning, better for heterogeneous systems
Both are vastly more efficient than JSON for streaming metrics.
6.3 Zero-Allocation Code Paths in the SignalR Pipeline
At scale, allocations are the enemy. A few extra objects per message don’t matter at low volume, but they add up quickly when broadcasting continuously.
6.3.1 Avoiding Transient Objects
Avoid patterns like this:
await Clients.All.SendAsync("Update", new { value });Anonymous objects allocate on every send. Prefer typed hub methods and reusable DTOs:
await Clients
    .Group(tenantId)
    .ReceiveMetricUpdate(metricDto);
This eliminates per-message allocations and makes the pipeline easier to reason about.
6.3.2 Reusing Serialization Buffers
For high-frequency serialization, reuse buffers instead of allocating new arrays:
var buffer = ArrayPool<byte>.Shared.Rent(1024);
try
{
    MessagePackSerializer.Serialize(buffer, metricDto);
}
finally
{
    ArrayPool<byte>.Shared.Return(buffer);
}
This keeps GC pressure low, especially under sustained load.
6.3.3 Avoiding LINQ in Hot Paths
LINQ is expressive but allocation-heavy. In hot paths—such as loops that run for every metric—prefer explicit loops. The difference becomes visible when message rates climb.
6.4 Managing Memory with ArrayPool, Memory<T>, and Span<T>
Memory pooling is one of the most effective optimizations in streaming systems. It reduces allocation frequency and keeps GC pauses short and predictable.
6.4.1 Pooling Buffers for Batched Writes
When batching metrics or serializing messages:
var pool = ArrayPool<byte>.Shared;
var buffer = pool.Rent(4096);

try
{
    var bytesWritten = SerializeBatch(metrics, buffer);
    await stream.WriteAsync(buffer.AsMemory(0, bytesWritten));
}
finally
{
    pool.Return(buffer);
}
This pattern avoids allocating new buffers for every batch.
6.4.2 Using Span<T> for Zero-Copy Access
Span<T> allows you to work directly on pooled memory:
Span<byte> span = buffer.AsSpan();
var size = MessagePackSerializer.Serialize(span, metricDto);
This avoids intermediate arrays and reduces CPU cache pressure.
6.4.3 Why This Matters for Dashboards
Lower GC pressure means:
- Fewer latency spikes
- More consistent frame delivery
- Better behavior under bursty traffic
These benefits are visible directly in the user experience.
6.5 Benchmarking the Pipeline
Optimizations only matter if they measurably improve behavior. Benchmarking ensures you’re fixing real problems instead of guessing.
6.5.1 Measuring Serialization Cost with BenchmarkDotNet
A focused benchmark makes allocation and CPU costs obvious:
[MemoryDiagnoser]
public class MetricSerializationBench
{
    private readonly MetricDto _dto =
        new() { MetricId = "cpu", Value = 42.0, Timestamp = 123456 };

    [Benchmark]
    public byte[] SerializeMessagePack()
        => MessagePackSerializer.Serialize(_dto);
}
Look for both execution time and allocated bytes.
6.5.2 Load Testing SignalR with k6
k6 can simulate thousands of WebSocket clients:
import ws from "k6/ws";

export default function () {
  ws.connect("ws://localhost/hub/metrics", socket => {
    socket.on("message", () => {
      // minimal client-side work
    });
  });
}
This reveals bottlenecks that unit benchmarks cannot.
6.5.3 Metrics That Matter Under Load
When evaluating results, focus on:
- P99 end-to-end latency
- GC pause duration and frequency
- Backplane fan-out latency
- Update delivery consistency
A well-optimized system maintains stable behavior even as message rates increase.
7 Real-World Implementation: The Metrics Dashboard
At this point, all major building blocks are in place: metrics are ingested into InfluxDB, processed efficiently, and streamed through SignalR. This section ties those pieces together into a working, end-to-end metrics dashboard. The focus here is not on theoretical patterns, but on how a real system continuously queries data, shapes it for presentation, and delivers it to users in a way that feels live and reliable.
7.1 Building the Background Worker: IHostedService for Continuous InfluxDB Querying
In most production dashboards, metrics are not pushed directly from ingestion to clients. Instead, a background worker periodically queries recent data, applies aggregation or filtering, and then publishes the results through SignalR. This keeps the ingestion path simple and isolates dashboard-specific logic.
7.1.1 Background Worker Structure
A typical implementation uses BackgroundService:
public sealed class MetricsWorker : BackgroundService
{
    private readonly IQueryApi _queryApi;
    private readonly IHubContext<MetricsHub, IMetricsClient> _hub;

    public MetricsWorker(
        IQueryApi queryApi,
        IHubContext<MetricsHub, IMetricsClient> hub)
    {
        _queryApi = queryApi;
        _hub = hub;
    }

    protected override async Task ExecuteAsync(
        CancellationToken stoppingToken)
    {
        while (!stoppingToken.IsCancellationRequested)
        {
            var metrics = await QueryRecentMetricsAsync(stoppingToken);

            foreach (var metric in metrics)
            {
                await _hub.Clients
                    .Group(metric.TenantId)
                    .ReceiveMetricUpdate(metric);
            }

            await Task.Delay(
                TimeSpan.FromMilliseconds(500),
                stoppingToken);
        }
    }

    private Task<List<MetricDto>> QueryRecentMetricsAsync(
        CancellationToken ct)
    {
        var flux = """
            from(bucket: "prod")
            |> range(start: -5s)
        """;

        return _queryApi.QueryAsync<MetricDto>(flux, ct);
    }
}
This worker runs continuously, querying a short rolling window and pushing updates roughly twice per second. That cadence balances freshness with predictable load.
7.1.2 Preventing Overlapping Queries
It’s important that each iteration finishes before the next one starts. Overlapping queries increase database load and can result in duplicated or out-of-order updates. Using a single execution loop with await and a cancellation token ensures the worker behaves predictably during shutdown and redeployments.
7.2 Efficient Aggregation: Using Window Functions to Reduce Data Volume
Streaming raw metrics directly to the UI rarely scales. Aggregation at the database layer dramatically reduces traffic and improves chart readability.
7.2.1 Aggregating at the Source
InfluxDB 3.0 supports SQL-style window functions, which are ideal for dashboard workloads. For example, aggregating CPU usage into one-second windows:
SELECT
  window_start,
  AVG(usage) AS avg_usage
FROM TABLE(
    TUMBLE(
        TABLE cpu_metrics,
        DESCRIPTOR(timestamp),
        INTERVAL '1 second'
    )
)
WHERE host = 'server-42'
GROUP BY window_start
Instead of sending dozens of samples per second, the worker now streams a single aggregated value per second.
7.2.2 Why This Matters for Dashboards
This approach provides clear benefits:
- Smaller payloads over SignalR
- Lower CPU usage on the client
- Smoother charts with less jitter
Most users cannot visually interpret sub-second fluctuations anyway. Aggregation improves clarity without sacrificing usefulness.
7.3 Frontend Integration with SignalR (React, Vue, Blazor)
On the frontend, the pattern is always the same: establish a SignalR connection, subscribe to updates, and incrementally update the chart state. The framework differences are mostly syntactic.
7.3.1 React Example
useEffect(() => {
  const connection = new signalR.HubConnectionBuilder()
    .withUrl("/hub/metrics")
    .withAutomaticReconnect()
    .build();

  connection.on("ReceiveMetricUpdate", metric => {
    setMetrics(prev =>
      [...prev.slice(-200), metric]
    );
  });

  connection.start();

  return () => {
    connection.stop();
  };
}, []);
This keeps a rolling window of the most recent data points, preventing unbounded memory growth.
7.3.2 Vue Example
mounted() {
  this.connection = new signalR.HubConnectionBuilder()
    .withUrl("/hub/metrics")
    .withAutomaticReconnect()
    .build();

  this.connection.on("ReceiveMetricUpdate", metric => {
    this.metrics.push(metric);
    if (this.metrics.length > 200) {
      this.metrics.shift();
    }
  });

  this.connection.start();
}
The logic mirrors the React example: incremental updates and bounded state.
7.3.3 Blazor Example
protected override async Task OnInitializedAsync()
{
    connection = new HubConnectionBuilder()
        .WithUrl(
            Navigation.ToAbsoluteUri("/hub/metrics"))
        .WithAutomaticReconnect()
        .Build();

    connection.On<MetricDto>(
        "ReceiveMetricUpdate",
        metric =>
        {
            Metrics.Add(metric);
            if (Metrics.Count > 200)
                Metrics.RemoveAt(0);

            InvokeAsync(StateHasChanged);
        });

    await connection.StartAsync();
}
Blazor requires explicit UI refresh calls, but the data flow remains the same.
7.4 Interactive Features: Real-Time Alerts and Thresholds
Dashboards become far more useful when they surface problems immediately instead of forcing users to watch charts constantly.
7.4.1 Backend Alert Logic
Threshold checks typically live in the processing layer:
if (metric.Value > threshold)
{
    var alert = new AlertDto(
        metric.MetricId,
        metric.Value,
        DateTime.UtcNow);

    await _hub.Clients
        .Group(metric.TenantId)
        .ReceiveAlert(alert);
}
This keeps alert logic centralized and consistent across all clients.
7.4.2 Frontend Alert Handling
On the client, alerts usually trigger visual cues:
connection.on("ReceiveAlert", alert => {
  showToast(
    `High ${alert.metricId}: ${alert.value}`
  );
});
Alerts arrive instantly, even if the user is not actively watching the relevant chart.
7.5 Error Handling and Resilience with Polly
In production, transient failures are inevitable. Network hiccups, short-lived database issues, or backplane delays should not crash the worker or stall updates indefinitely.
7.5.1 Retry Policies for Queries
Polly makes retries explicit and controlled:
var retryPolicy = Policy
    .Handle<Exception>()
    .WaitAndRetryAsync(
        retryCount: 3,
        sleepDurationProvider:
            attempt => TimeSpan.FromMilliseconds(200));

await retryPolicy.ExecuteAsync(
    () => _queryApi.QueryAsync<MetricDto>(flux));
Retries smooth over brief failures without overwhelming InfluxDB.
7.5.2 Circuit Breakers for Stability
When failures persist, circuit breakers prevent cascading damage:
var breakerPolicy = Policy
    .Handle<Exception>()
    .CircuitBreakerAsync(
        exceptionsAllowedBeforeBreaking: 5,
        durationOfBreak:
            TimeSpan.FromSeconds(10));
Combined with retries, this allows the system to recover gracefully instead of oscillating under load.
8 Production Deployment, Observability, and Future-Proofing
Once a real-time metrics dashboard is working end to end, the next challenge is keeping it reliable over time. Production systems change constantly: traffic patterns shift, nodes are rescheduled, metrics volume grows, and infrastructure evolves. Deployment, observability, and cost controls are what keep the system stable as those changes happen. This section focuses on running the dashboard in production—how to package it, observe its behavior, detect problems early, and prepare for the next generation of real-time transport.
8.1 Containerization with Docker and Kubernetes Resource Limits
Most modern SignalR deployments run in containers, often orchestrated by Kubernetes. While SignalR itself is lightweight, real-time workloads are sensitive to CPU starvation, memory pressure, and network interruptions. Container configuration directly affects user experience.
8.1.1 Dockerfile for Native AOT Builds
With Native AOT, the final container image is small and starts quickly—an advantage during scaling events or node restarts.
FROM mcr.microsoft.com/dotnet/runtime-deps:10 AS base

FROM mcr.microsoft.com/dotnet/sdk:10 AS build
WORKDIR /src
COPY . .
RUN dotnet publish -c Release -o /app --no-restore

FROM base AS final
WORKDIR /app
COPY --from=build /app .
ENTRYPOINT ["./signalr-metrics"]
This produces a self-contained binary with no runtime dependencies beyond the base image. Cold starts are fast, which helps maintain connection stability during rolling deployments.
8.1.2 Kubernetes Resource Limits
Real-time systems behave poorly when CPU is oversubscribed. Kubernetes resource limits should reflect that reality.
resources:
  requests:
    cpu: "500m"
    memory: "512Mi"
  limits:
    cpu: "1"
    memory: "1Gi"
Requests ensure the pod is scheduled on a node with sufficient capacity. Limits prevent runaway memory usage. For SignalR nodes, predictable CPU availability matters more than raw throughput.
8.2 Observability with OpenTelemetry
When something slows down in a real-time pipeline, guessing is expensive. Observability turns latency into data you can reason about.
8.2.1 Why End-to-End Tracing Matters
In a metrics dashboard, delays can come from several places:
- InfluxDB queries taking longer than expected
- Serialization overhead under load
- SignalR fan-out slowing due to backpressure
- Redis backplane latency
Without traces, these problems look the same from the outside.
8.2.2 Instrumenting the Worker and Hubs
Adding OpenTelemetry tracing makes these costs visible:
builder.Services.AddOpenTelemetry()
    .WithTracing(tracing =>
    {
        tracing
            .AddSource("MetricsWorker")
            .AddAspNetCoreInstrumentation()
            .AddHttpClientInstrumentation()
            .AddOtlpExporter();
    });
Each background query, hub invocation, and outbound call becomes part of a single trace.
8.2.3 Reading the Traces
With tracing enabled, you can see:
- How long InfluxDB queries actually take
- How much time is spent serializing messages
- How long SignalR broadcasts take per update
This makes performance regressions obvious instead of speculative.
8.3 Health Checks for SignalR and InfluxDB
Health checks are how Kubernetes decides whether a pod should keep running. For a real-time dashboard, health checks should focus on liveness, not just process existence.
8.3.1 Registering Health Checks
builder.Services.AddHealthChecks()
    .AddCheck<HubHealthCheck>("signalr")
    .AddInfluxDB(
        name: "influxdb",
        uri: new Uri("http://influxdb:8086/api/v2/ping"));
This ensures both the SignalR layer and the database connection are monitored.
8.3.2 Hub Health Logic
A hub health check should stay lightweight:
public sealed class HubHealthCheck : IHealthCheck
{
    public Task<HealthCheckResult> CheckHealthAsync(
        HealthCheckContext context,
        CancellationToken cancellationToken = default)
    {
        // Optionally validate internal state or backplane connectivity
        return Task.FromResult(HealthCheckResult.Healthy());
    }
}
Avoid expensive checks here. Health probes run frequently and should never block the hub.
8.3.3 Why This Matters in Production
If a SignalR node loses its Redis connection or becomes unresponsive, health checks allow Kubernetes to replace it quickly—often before users notice.
8.4 Cost Optimization: InfluxDB Cloud vs. Self-Hosted
Metrics systems generate data continuously, which makes cost a first-class concern. Choosing the right InfluxDB deployment model has a significant financial impact.
8.4.1 When InfluxDB Cloud Makes Sense
InfluxDB Cloud works well when:
- Data volume is moderate
- Operational simplicity is more important than raw cost
- Teams want managed backups and scaling
Costs scale with ingestion, queries, and storage, so visibility into usage is essential.
8.4.2 When Self-Hosting Becomes Cheaper
At sustained ingestion rates—often several gigabytes per hour—self-hosting can be significantly cheaper. The trade-off is operational responsibility: upgrades, backups, and capacity planning move to your team.
8.4.3 Hybrid Retention Strategies
Many teams use a hybrid model:
- Hot, recent data in InfluxDB Cloud
- Downsampled or cold data in self-hosted clusters or object storage
This balances cost with operational simplicity while keeping dashboards responsive.
8.5 Looking Ahead: WebTransport and HTTP/3
WebSockets have served real-time systems well, but they are not the final word on transport.
8.5.1 Why WebTransport Matters
WebTransport, built on HTTP/3, offers:
- Lower connection setup latency
- Multiple independent streams per connection
- Better behavior on unreliable networks
These properties are especially valuable for dashboards used over mobile or long-distance connections.
8.5.2 SignalR and Emerging Transports
SignalR does not yet support WebTransport natively, but ongoing experimentation suggests future support is likely. Early tests show improved stability when packet loss or network changes occur.
8.5.3 Preparing Your Infrastructure
To stay future-ready:
- Ensure load balancers and ingress controllers support HTTP/3
- Avoid assumptions tied strictly to WebSocket semantics
- Keep serialization and protocol layers transport-agnostic
When new transports become available, these decisions make adoption far easier.